

- Published on
AI agent observability with OpenLIT and Parseable
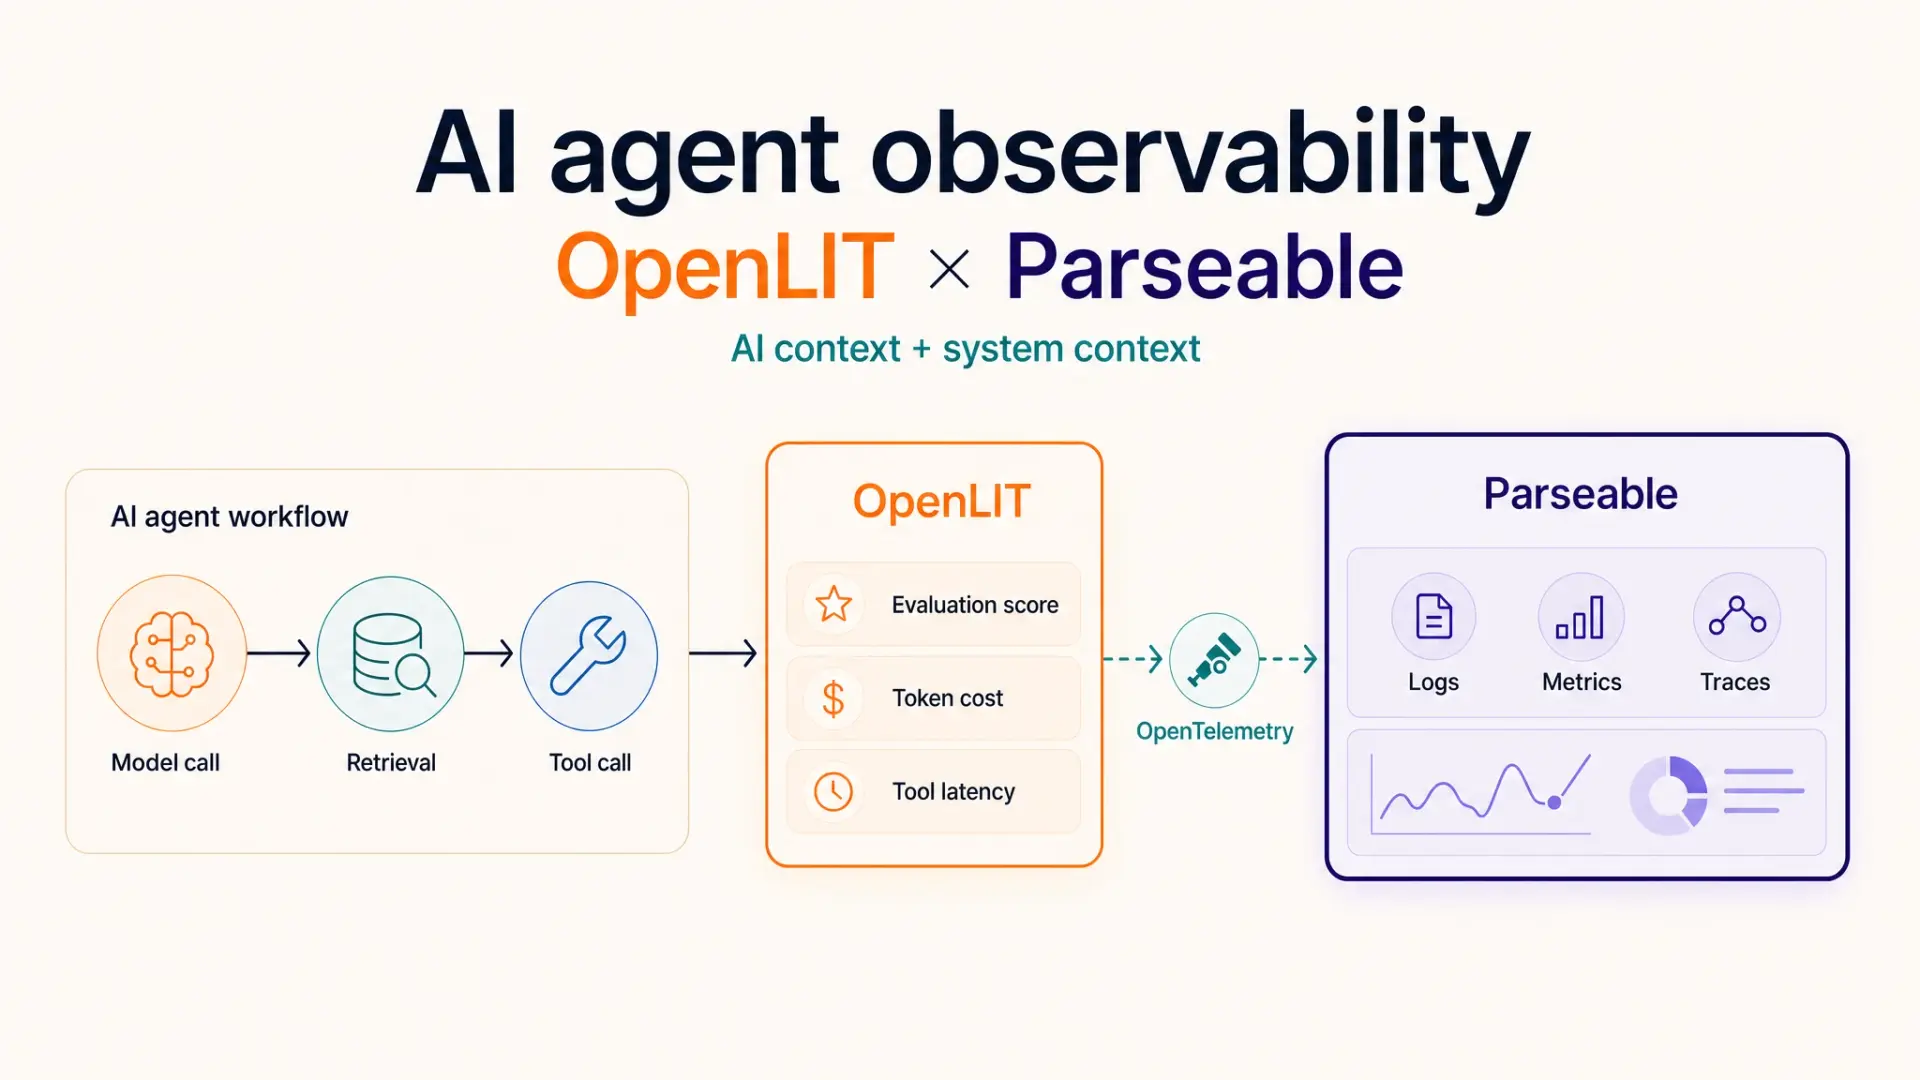
This post is a joint effort by the OpenLIT and Parseable teams. OpenLIT contributes OpenTelemetry-native instrumentation and evaluation for LLM applications and AI agents. Parseable contributes the storage, query and operational layer for the resulting logs, metrics and traces. We wrote it together because an agent trace becomes much more useful when it can be investigated beside the application and infrastructure it touched.
An AI agent can return a technically successful response and still be completely wrong.
The model request returns 200. Latency stays below the alert threshold. The final answer sounds confident. Meanwhile, the agent retrieved an old document, retried a failed tool and guessed what the missing result should have been. A conventional service dashboard sees a healthy request. An LLM-only trace may show the model call but miss the database timeout or GPU pressure around it.
Production AI agent observability needs both views. Engineers need AI-specific context such as prompts, model versions, tool calls, tokens, cost and evaluations. They also need the ordinary system evidence that never stopped mattering: logs, service traces, HTTP errors, container metrics and deployment changes.
OpenLIT and Parseable connect those views through OpenTelemetry. OpenLIT describes what the agent did. Parseable retains and analyzes that telemetry with the rest of the stack.
What the combined stack looks like
The data path has two required layers, with an optional OpenTelemetry Collector between them:
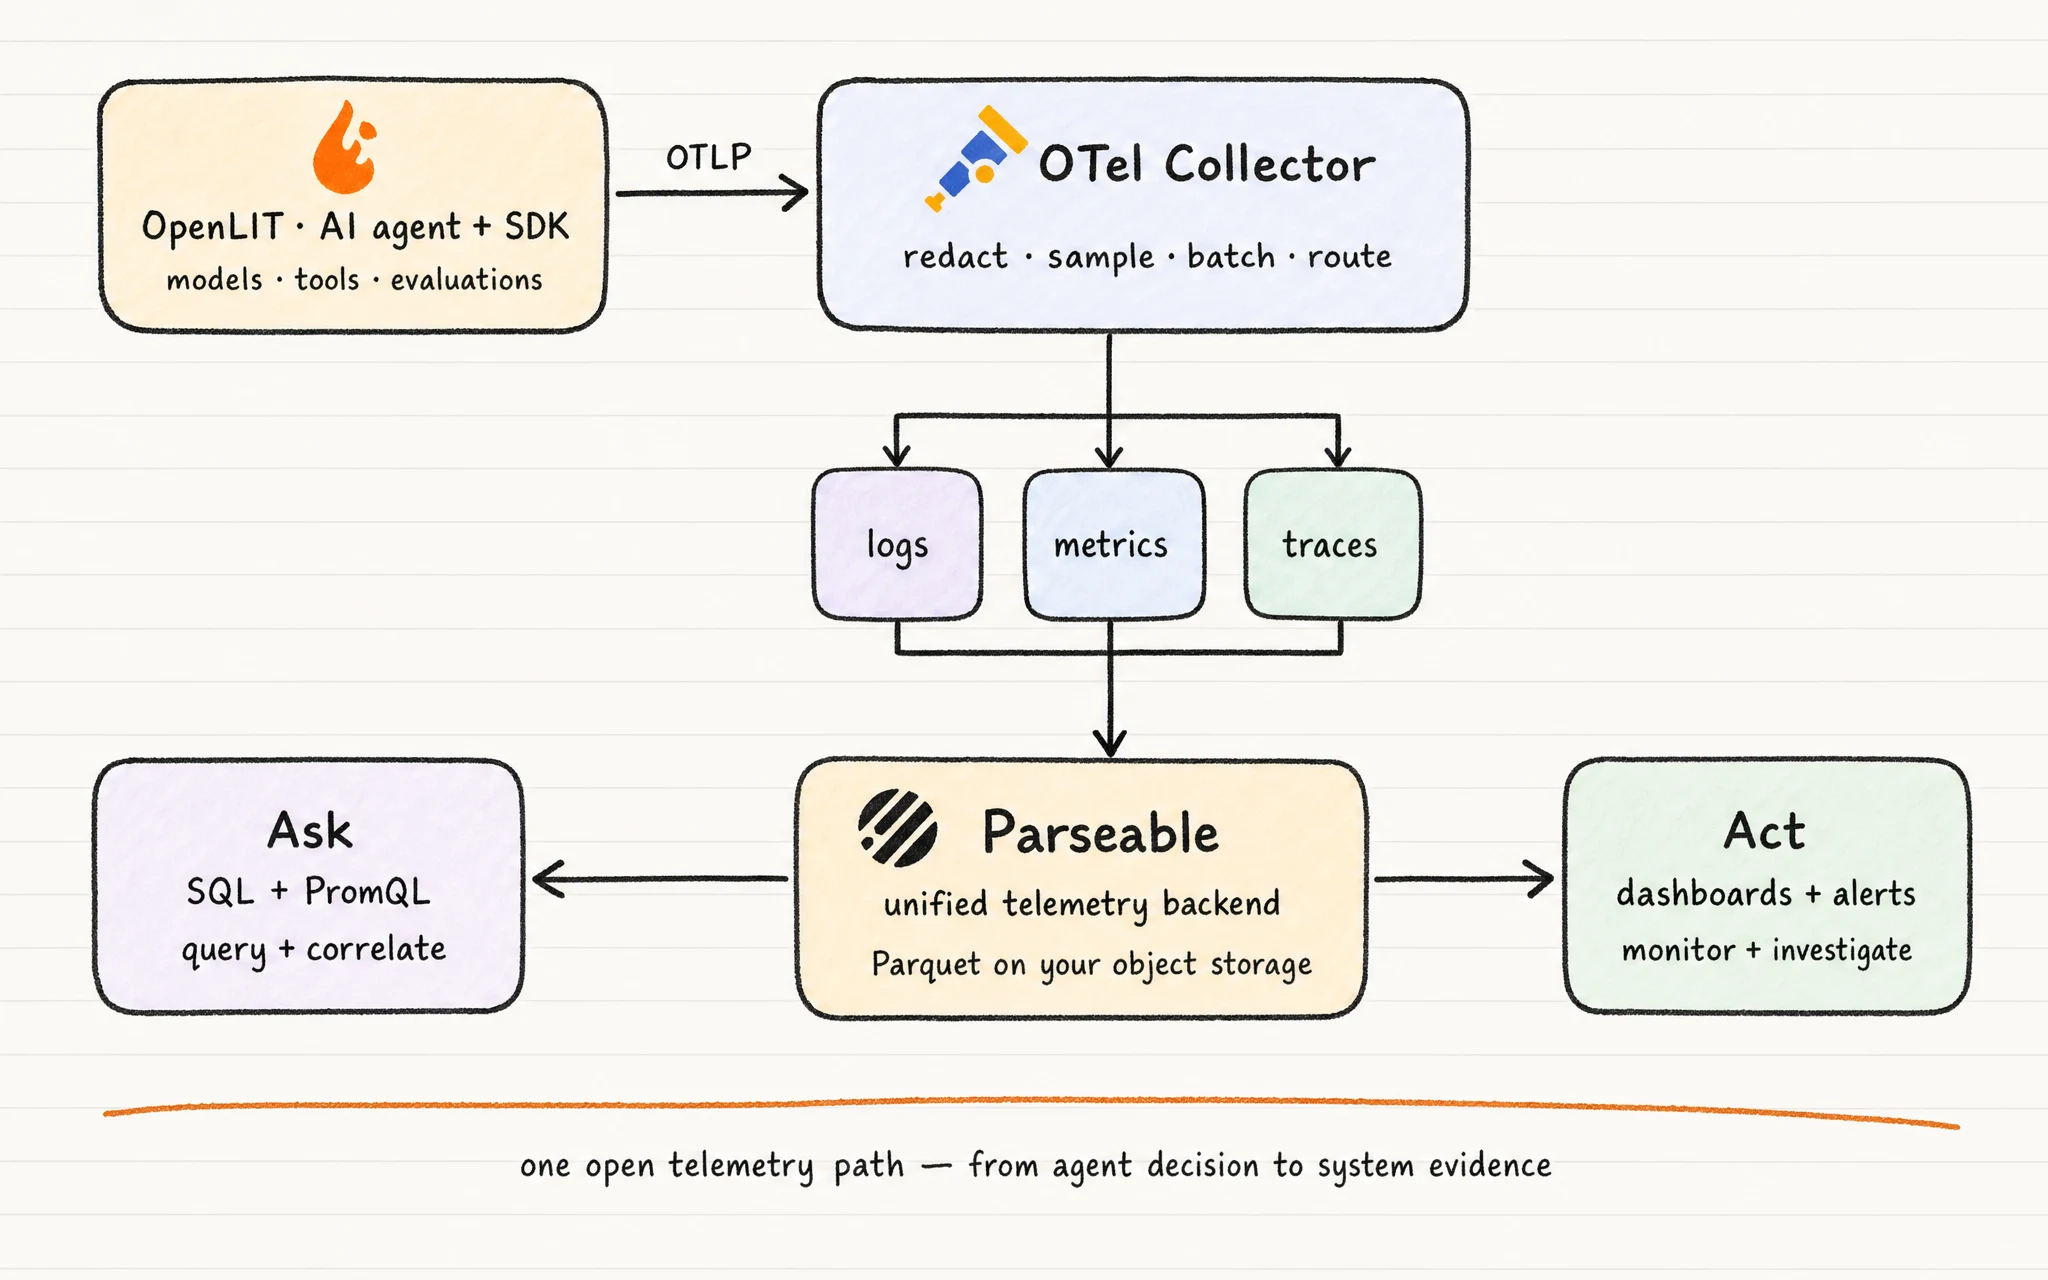
OpenLIT capturing AI agent telemetry, the OpenTelemetry Collector processing it and Parseable retaining and analyzing it
OpenTelemetry keeps the instrumentation and backend loosely coupled. OpenLIT emits standard GenAI attributes and OpenTelemetry signals. The Collector provides a neutral processing boundary. Parseable accepts the three signals through OTLP and keeps them in storage the team controls.
This separation also makes the responsibilities clear:
| Layer | What it contributes |
| OpenLIT | AI and LLM instrumentation, agent and tool traces, token and cost metrics, evaluations, guardrails, prompt context and system metrics |
| Parseable | OTLP ingestion, logs, metrics and traces, object-storage retention, SQL and PromQL, dashboards, alerts and incident investigation |
You can run OpenLIT and Parseable in your own environment, and the telemetry remains portable because the connection uses OTLP rather than a private agent-to-backend protocol.
OpenLIT adds the AI context
HTTP spans can tell you that an agent is called OpenAI or Anthropic. They cannot tell you enough about the agent workflow by themselves.
OpenLIT's SDK auto-instruments supported model providers, agent frameworks, vector databases and tools. A multi-step run can be represented with operations such as invoke_workflow, invoke_agent, chat and execute_tool, rather than appearing as a pile of unrelated outbound requests.
The resulting spans and metrics can include:
model, provider and operation names
workflow, agent and conversation identifiers
tool names, calls, duration and error state
input, output and cached token usage
model cost calculated by OpenLIT
prompt and response content when capture is enabled
evaluation and guardrail results
CPU, memory and GPU signals when system collection is enabled
That coverage is useful before an incident happens. Token and cost metrics expose expensive models or workflows. Tool spans show which dependency is slowing the agent down. Conversation and workflow attributes let an engineer inspect one run without treating every model call as a separate request.
Evaluations belong beside operational telemetry
OpenLIT supports programmatic and platform evaluations for hallucination, bias, toxicity, relevance, faithfulness and other quality dimensions. Evaluation results can be collected as OpenTelemetry metrics, which means they can follow the same route as latency, cost and error signals.
This changes the questions a production dashboard can answer. Instead of tracking only “is the model responding?”, a team can compare quality scores with prompt, model or agent releases. A fall in faithfulness after a retrieval change becomes an operational regression rather than a vague complaint in a support ticket.
OpenLIT also provides prompt management and guardrails. Those features remain separate from the telemetry backend: Prompt Hub versions the instructions that shape a run, while evaluations and guardrails generate evidence about the output. Include the prompt version in telemetry and you can relate a quality change to the exact release that introduced it.
Parseable adds the system context and history
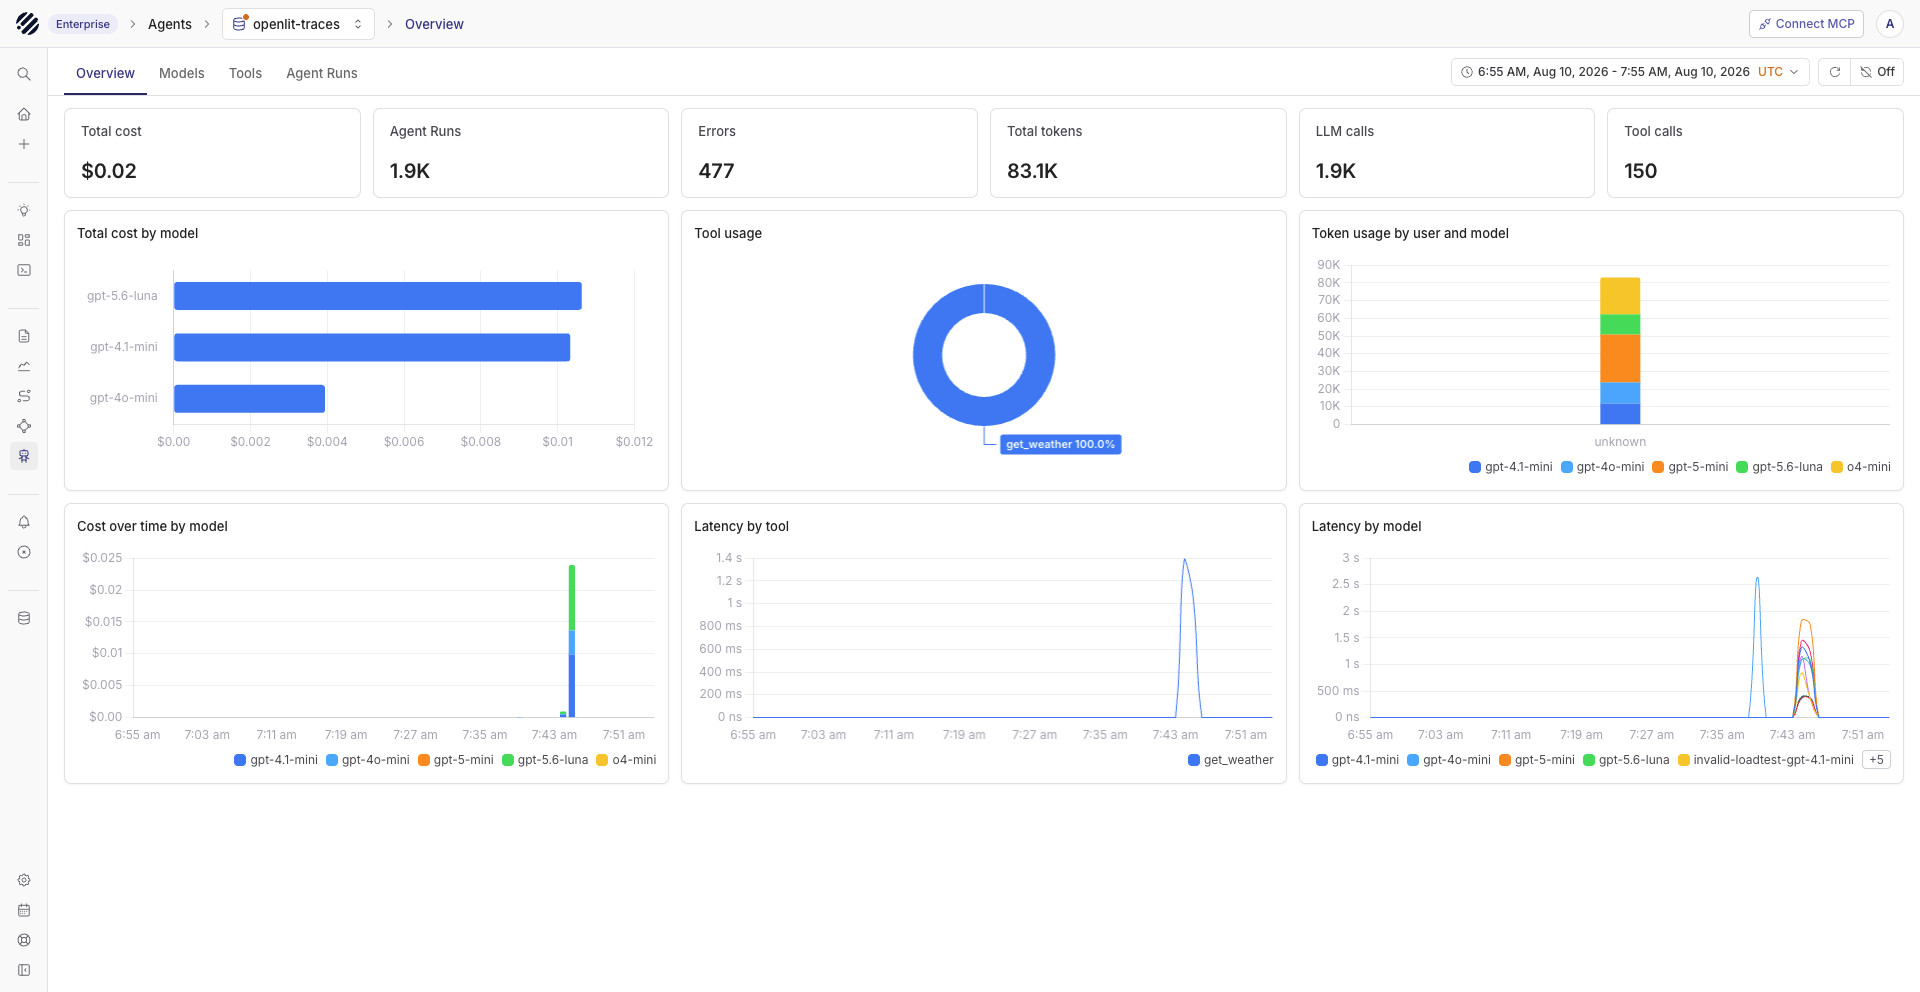
Parseable’s agent overview combines cost, tokens, errors, model latency and tool usage.
AI agent telemetry becomes noisy quickly. One user request can create several model calls, retrieval spans, tool invocations, application logs and infrastructure metrics. A multi-agent workflow creates more branches and more high-cardinality identifiers.
Parseable is an open-source observability data lake. It ingests OpenTelemetry logs, metrics and traces, stores each signal as columnar Parquet on object storage, and separates durable storage from query compute. Teams can use S3-compatible storage, Google Cloud Storage, Azure Blob Storage or MinIO as the source of truth.
The backend provides several ways to work with the retained data:
trace views for following an agent run and its downstream services
SQL for ad hoc analysis across structured telemetry fields
PromQL for metrics and operational dashboards
dashboards and alerts over saved queries
dataset-level retention and access controls
AI-assisted dataset summaries and text-to-SQL through Keystone
Parseable stores logs, metrics and traces in signal-appropriate datasets, but shared trace IDs and resource attributes keep them connected during an investigation. An engineer can start with an expensive model call, pivot to the tool span, inspect logs from the service that implemented the tool and compare node or GPU metrics over the same window.
Object storage matters here because AI investigations are not always immediate. A customer may report a bad answer days later. A quality regression can take a week to become obvious. Retaining the underlying events makes those comparisons possible without keeping every field in an expensive search index.
Instrument an agent with OpenLIT
For a Python application, point OpenLIT at an OpenTelemetry Collector:
import openlit

openlit.init(
    otlp_endpoint="http://otel-collector:4318",
    service_name="refund-agent",
    deployment_environment="production"
)
This enables automatic instrumentation for supported libraries. Start with content capture disabled. Prompt and response bodies can contain customer data, credentials or internal documents, while model, operation, token, duration and status fields already answer many operational questions.
Add the business attributes that make a run recognizable:
prompt and knowledge-base version
agent release or feature flag
workflow name
a request or conversation identifier shared with application logs
a stable tenant identifier, preferably pseudonymized
Do not put conversation IDs, user IDs or arbitrary prompt text on metric labels. Keep unbounded values on spans or logs and reserve metric dimensions for bounded fields such as provider, model, operation and environment.
Send OpenTelemetry data to Parseable
The Collector keeps Parseable credentials out of the application and gives platform teams one place to redact, batch, retry and sample telemetry.
The exporter portion below routes each signal to a separate Parseable dataset. Replace the endpoints and credentials with values from your deployment:
exporters:
  otlphttp/parseable_logs:
    logs_endpoint: 'https://your-parseable.example/v1/logs'
    encoding: json
    compression: gzip
    headers:
      Authorization: 'Basic <BASE64_CREDENTIALS>'
      X-P-Stream: 'agent-logs'
      X-P-Log-Source: 'otel-logs'

  otlphttp/parseable_metrics:
    metrics_endpoint: 'https://your-parseable.example/v1/metrics'
    encoding: json
    compression: gzip
    headers:
      Authorization: 'Basic <BASE64_CREDENTIALS>'
      X-P-Stream: 'agent-metrics'
      X-P-Log-Source: 'otel-metrics'

  otlphttp/parseable_traces:
    traces_endpoint: 'https://your-parseable.example/v1/traces'
    encoding: json
    compression: gzip
    headers:
      Authorization: 'Basic <BASE64_CREDENTIALS>'
      X-P-Stream: 'agent-traces'
      X-P-Log-Source: 'otel-traces'
Connect the exporters to their respective pipelines under service.pipelines. The OpenTelemetry and Parseable stack guide includes a full three-signal Collector configuration with receivers and processors.
For production, add the memory limiter and batch processors, enable retries, and consider a persistent sending queue. Redaction must run before export. Tail sampling can keep failed, slow or unusually expensive traces while sampling routine completions.
What can you do with the combined telemetry?
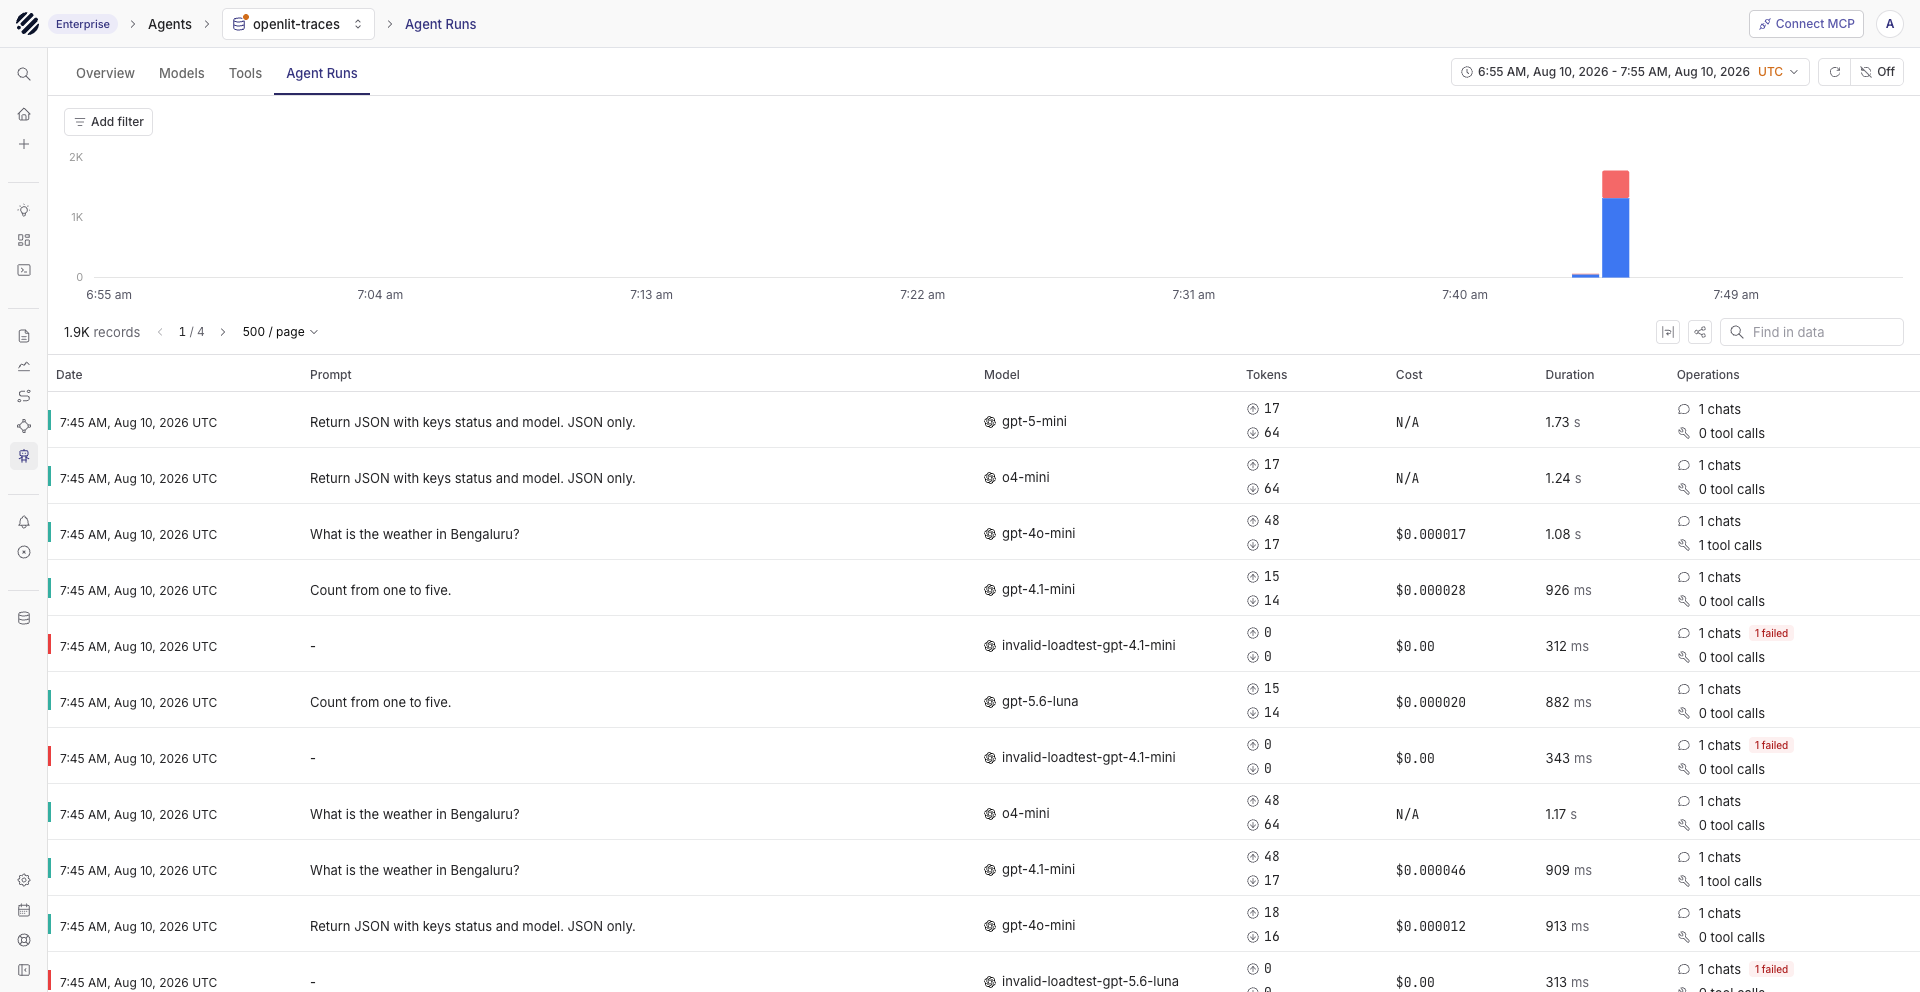
Agent runs can be filtered and compared by model, tokens, cost, duration and failures.
The value of this stack shows up in questions that cross the AI and system boundary.
Find which agent path is consuming the budget
OpenLIT records token use and cost with model, provider, operation and workflow context. Parseable can retain those measurements and group them over time by application, team, agent or model.
A cost spike can then be separated into useful causes: more traffic, a model change, longer prompts, poor cache usage or an agent repeatedly calling the same tool. “The OpenAI bill went up” is accurate but not especially actionable.
Debug tool latency with application evidence
An execute_tool span identifies the operation that held up a workflow. The shared trace ID connects it to the HTTP or database spans below it and the application logs emitted by the service.
This is where general infrastructure observability and LLM observability stop competing for ownership of the incident. The agent trace explains why the tool was called. The service telemetry explains why it took four seconds.
Compare quality before and after a release
OpenLIT evaluations produce quality and safety results. Attach prompt, model and agent versions to the same telemetry, then use Parseable to compare the scores and operational signals across releases.
A prompt update may improve relevance while increasing output tokens. A model migration may lower cost but raise tool retries because its arguments no longer match the expected schema. Looking at evaluation, cost and execution data together catches trade-offs that a single quality score hides.
Correlate model latency with infrastructure
For self-hosted inference, model latency is often an infrastructure question. OpenLIT can collect system and GPU metrics, while Parseable can ingest them beside model duration, token throughput and application traces.
When time to first token rises, engineers can check GPU utilization, memory pressure, queue depth and deployment changes over the same interval. The investigation stays attached to the agent and model attributes that users experienced.
Reconstruct one bad answer
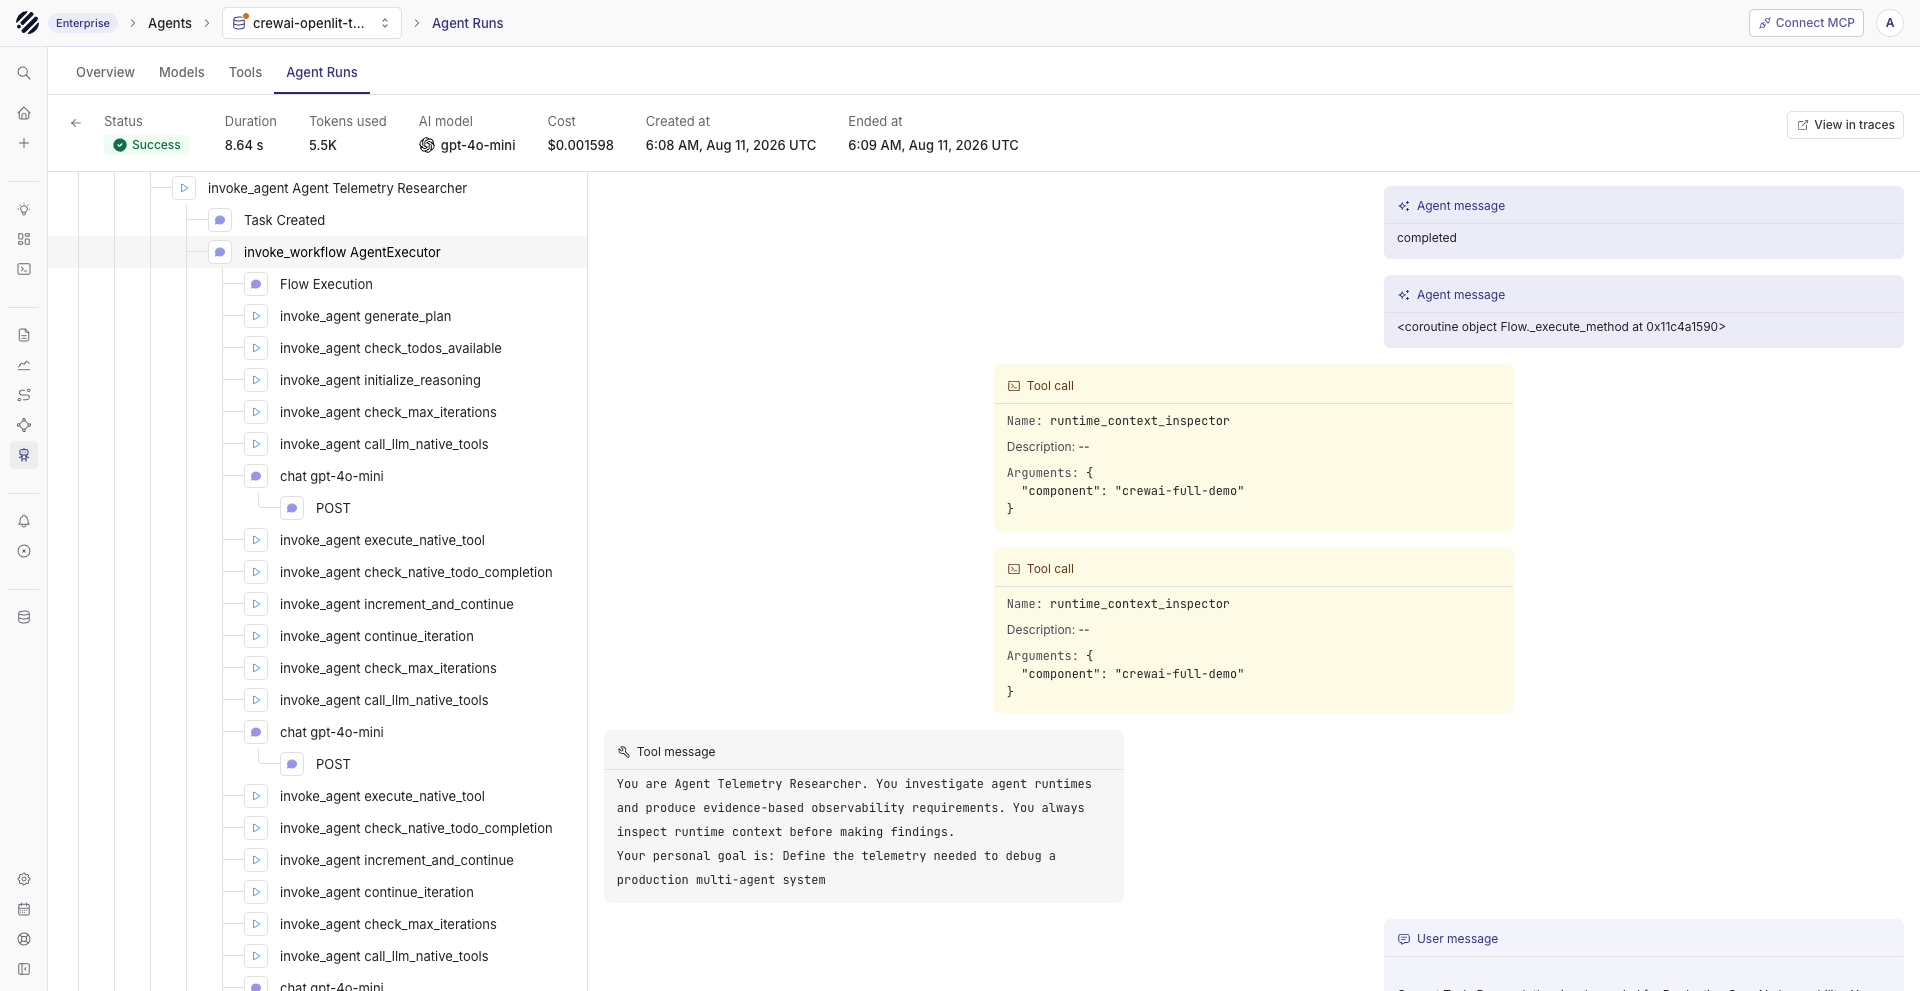
A single run exposes workflow steps, model calls, tool arguments and messages.
Suppose a support agent claims that a refund was approved. Its model request succeeded and latency was normal, so neither signal explains the failure. The retained trace shows the complete request path:
invoke_agent  refund-agent                         8.4s
├── execute_tool  policy-search                    0.3s
├── chat          response-planner                 2.1s
├── execute_tool  order-service                    2.0s  timeout
├── execute_tool  order-service                    2.1s  retry
└── chat          customer-response                1.7s
The retrieval span points to an obsolete policy. The first order call timed out, the retry returned pending, and the response prompt did not require an approval ID. Application logs confirm that no refund was created. OpenLIT captures the AI execution, while Parseable keeps it with the retrieval, service and infrastructure evidence needed to explain the result.
Turn production failures into evaluations
The same incident can become a regression case. Preserve its shape without copying private production content: stale retrieval, a timed-out tool, an ambiguous retry and a response that must not claim success without confirmation.
Run that case through OpenLIT evaluations when the prompt, model or workflow changes. Add an application-specific assertion that an approval response must contain a confirmed approval ID. Export the evaluation result with the same version attributes used in production.
Parseable can retain the incident telemetry and evaluation history for comparison. OpenLIT runs the quality checks. Together they keep the reason for the test attached to the production behavior that prompted it.
Privacy, cardinality and retention
Agent observability can collect sensitive and high-cardinality data. Set the boundaries before enabling broad content capture.
Redact before export. Remove secrets and personal data in the application or Collector. The PII removal guide covers Collector processors for this boundary.
Keep identifiers off metric labels. Conversation, response, tool-call and user IDs belong on spans or logs. Metrics should use bounded dimensions.
Version rather than copy when possible. A prompt version is safer and easier to group than the complete prompt. Capture content only when the investigation or evaluation requires it.
Retain by value. Routine traces, evaluation failures and aggregate metrics do not need identical retention. Parseable supports dataset-level policies, while the Collector can sample traces by status, latency or attributes before ingestion.
Monitor the pipeline. Watch refused spans, dropped data, exporter failures and queue growth. The Collector metrics guide explains the signals that reveal a pipeline failure.
When this stack fits
OpenLIT and Parseable fit teams that want an open, self-hostable path across AI and infrastructure observability. The pairing is useful when you:
operate agents with several models, tools or frameworks
need evaluations and operational signals in the same analysis loop
investigate individual sessions after the fact
correlate AI behavior with services, containers or GPUs
retain telemetry on object storage you control
want OTLP portability instead of a private telemetry path
A small prototype may be easier to inspect in a hosted LLM tracing product. The OpenLIT and Parseable stack becomes useful when the agent is part of a real system with production incidents, data policies, cost ownership and release regressions.
A practical starting checklist
Instrument one agent with OpenLIT and send OTLP to a Collector.
Add application, environment, agent and release attributes.
Route traces, metrics and related logs from the Collector to Parseable.
Confirm that one trace ID reaches the agent, tool and downstream service.
Add one evaluation that reflects a real product requirement.
Trigger a controlled tool timeout and verify the complete investigation path.
Set redaction, access and retention rules before enabling content capture.
Start with one workflow and one failure you care about. Expand the telemetry after the first investigation shows which missing field would have saved time.

- Name
- Aman Agarwal
- GitHub
- @AmanAgarwal041