- Published on
Monitoring LLM Usage in OpenWebUI with OpenLIT
Overview
OpenWebUI is a popular open-source interface for interacting with locally hosted LLMs like Ollama and self-hosted OpenAI-compatible servers. While it excels as a user-facing chat interface, its built-in monitoring capabilities are limited — you get basic conversation history but no visibility into token usage, inference latency, GPU load, or cost per query.
By integrating OpenLIT into OpenWebUI's pipeline system, you gain full OpenTelemetry-native observability: distributed traces for every LLM call, token and cost metrics, GPU performance tracking, and a centralized dashboard to analyse usage across sessions and models.
This guide explains how to configure OpenLIT with OpenWebUI using the pipelines middleware, what data you get, and how to interpret it.
Why Observability Matters for OpenWebUI Deployments
When running inference directly through OpenWebUI — whether via Ollama, a local vLLM server, or a remote OpenAI-compatible endpoint — several questions are hard to answer without instrumentation:
How many tokens is each conversation consuming? Token counts affect both inference speed and, for paid APIs, direct cost.
Which model is the most responsive? When multiple models are available in OpenWebUI, comparing their latency helps you set appropriate expectations for users.
Is the GPU being saturated? For local Ollama deployments, the GPU is the bottleneck. Without GPU metrics, you cannot tell if users are experiencing slowdowns due to thermal throttling or memory pressure.
What are the most common prompts? Aggregating prompt patterns helps identify misuse, tune system prompts, and build better defaults.
OpenLIT answers all of these by intercepting requests in the pipeline layer, instrumenting the LLM call with the OpenTelemetry SDK, and forwarding structured telemetry to its dashboard.
Architecture: How OpenLIT Integrates with OpenWebUI
OpenWebUI's pipeline system is an HTTP middleware layer that sits between the OpenWebUI frontend and the actual model endpoints. When a pipeline is active, every chat request flows through it before reaching the model.
OpenWebUI UI
     │
     ▼
Pipeline Server (localhost:9099)
     │
     ├── openlit.init() runs on startup
     ├── Each request creates an OpenTelemetry trace
     │
     ▼
LLM Endpoint (Ollama / OpenAI-compatible server)
     │
     ▼
OpenTelemetry Collector / OpenLIT Backend
     │
     ▼
OpenLIT Dashboard (localhost:3000)
The pipeline server is a Python FastAPI application. OpenLIT's SDK is imported once in on_startup() and instruments all subsequent OpenAI client calls automatically — no additional code changes per request are needed.
Setting Up the OpenLIT Stack
Before configuring the pipeline, deploy the OpenLIT observability backend:
git clone https://github.com/openlit/openlit.git
cd openlit
docker compose up -d
This starts:
OpenLIT UI on port
3000ClickHouse on port
8123(trace and metric storage)OpenTelemetry Collector on port
4318(OTLP/HTTP receiver)
Verify it is running by visiting http://localhost:3000. The dashboard will be empty until your first traces arrive.
Setting Up the Pipeline
Configuring Pipelines in OpenWebUI
Follow the OpenWebUI pipeline documentation to set up the pipeline server. You can install it via:
Direct installation: Installation and Setup Guide
Using Docker: Quick Start with Docker
The simplest Docker-based approach:
docker run -d \
  -p 9099:9099 \
  --add-host=host.docker.internal:host-gateway \
  -v pipelines:/app/pipelines \
  --name pipelines \
  --restart always \
  ghcr.io/open-webui/pipelines:main
Creating the Pipeline Code
There are multiple example pipeline scripts available in the OpenWebUI GitHub repository.
Below is a production-ready pipeline script that integrates OpenLIT with OpenWebUI, including GPU monitoring and environment tagging:
"""
title: OpenLIT Monitoring Pipeline
author: openlit
date: 2025-02-28
version: 1.1
license: MIT
description: A pipeline for monitoring OpenWebUI LLM usage with OpenLIT observability.
requirements: openlit==1.33.8, openai==1.61.1
"""
from typing import List, Union, Generator, Iterator
from schemas import OpenAIChatMessage
from openai import OpenAI
import openlit


class Pipeline:
    def __init__(self):
        self.name = "OpenLIT Monitoring"
        self.client = None

    async def on_startup(self):
        print(f"on_startup: {__name__}")

        # Initialize OpenLIT — runs once when the pipeline server starts
        openlit.init(
            otlp_endpoint="http://host.docker.internal:4318",  # OpenLIT collector
            collect_gpu_stats=True,          # Enable GPU monitoring for Ollama hosts
            environment="production",
            application_name="openwebui"
        )

        # Initialize the OpenAI client pointed at your local model server
        self.client = OpenAI(
            base_url="http://host.docker.internal:11434/v1",  # Ollama default
            api_key="ollama",  # Ollama ignores the key but requires a non-empty value
        )

    async def on_shutdown(self):
        print(f"on_shutdown: {__name__}")

    def pipe(
        self,
        user_message: str,
        model_id: str,
        messages: List[dict],
        body: dict,
    ) -> Union[str, Generator, Iterator]:
        print(f"pipe: {__name__} — model: {model_id}")

        completion = self.client.chat.completions.create(
            model=model_id,
            messages=messages,
        )

        return completion.choices[0].message.content
Key Configuration Notes
otlp_endpoint: Use host.docker.internal when the pipeline runs inside Docker and OpenLIT's collector runs on the host. If both are on the same Docker network, use the container name instead.
collect_gpu_stats=True: This enables automatic collection of GPU utilization, memory, temperature, and power draw. Requires NVIDIA drivers and nvidia-ml-py to be available in the pipeline container. For CPU-only setups, omit this parameter.
model_id: OpenWebUI passes the selected model ID at runtime. Using model_id in the OpenAI client call means the pipeline works with any model the user selects — no hardcoded model names.
Configuration for Remote OpenAI-Compatible Endpoints
If you are routing traffic to a hosted provider (OpenAI, Azure OpenAI, Groq, etc.) rather than a local Ollama instance, update the client initialization in on_startup():
import os

self.client = OpenAI(
    api_key=os.environ.get("OPENAI_API_KEY"),
    # base_url defaults to api.openai.com — omit for standard OpenAI
)
OpenLIT's instrumentation is provider-agnostic: it instruments the openai Python client regardless of which endpoint it points to, so cost and token tracking work for both local and hosted models.
Importing the Pipeline into OpenWebUI
To activate the pipeline:
Navigate to Admin Panel → Settings → Connections
Click + to add a new connection
Set the API URL to
http://localhost:9099(orhttp://YOUR-IP:9099if the pipeline server is on a different machine)Set the API Key to
open-webuiConfirm the connection — a Pipelines icon will appear next to the API Base URL field
Navigate to the Pipelines settings and upload your pipeline Python file
Your pipeline is now active. Every chat request in OpenWebUI flows through it, and OpenLIT begins capturing telemetry.
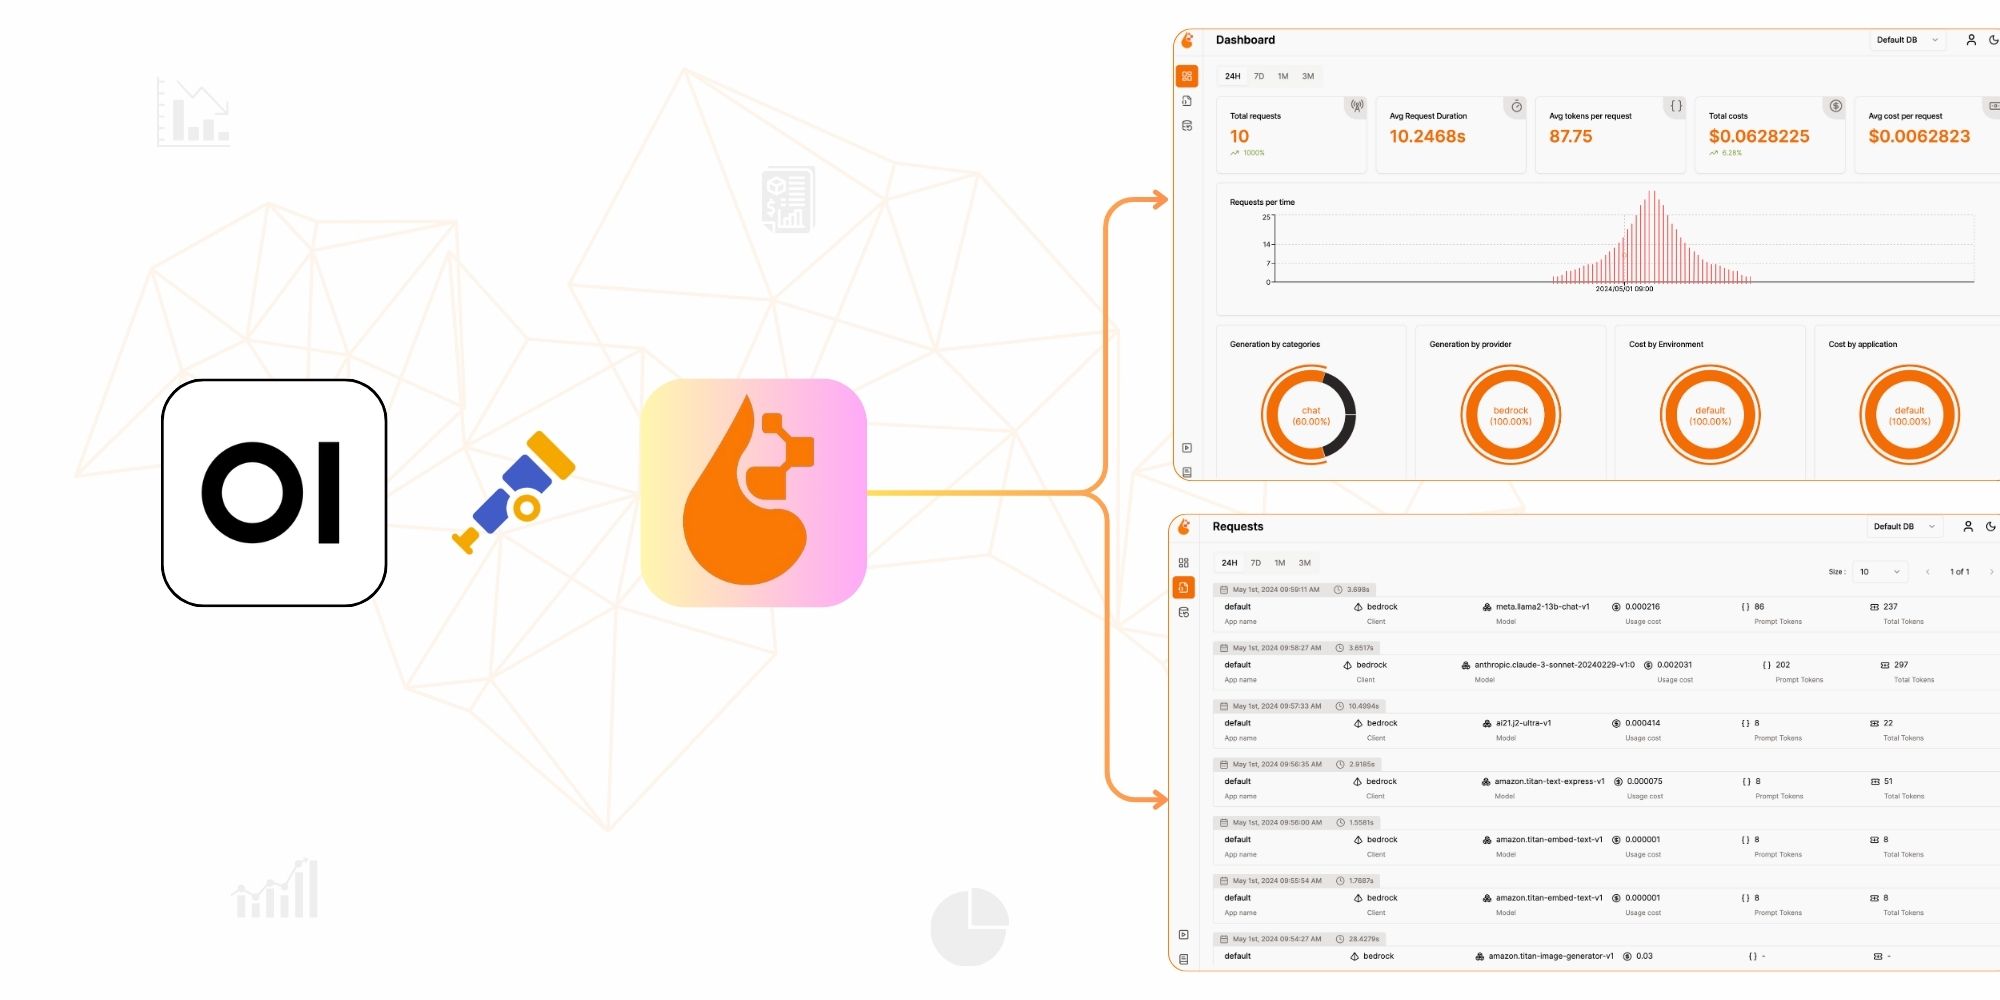
What You See in the OpenLIT Dashboard
After sending a few chat messages through OpenWebUI, open the OpenLIT dashboard at http://localhost:3000.
Requests View
Each LLM call from OpenWebUI appears as a trace entry showing:
Model — the Ollama model or OpenAI model selected by the user
Prompt tokens / Completion tokens / Total tokens — automatically calculated
Cost — for OpenAI-compatible endpoints; for local Ollama models, cost is $0 (self-hosted)
Duration — total time from request to final token
Prompt — the full system prompt + conversation history sent to the model
Response — the complete model output
GPU Metrics (if enabled)
If collect_gpu_stats=True is set and you are running on an NVIDIA GPU, the dashboard adds GPU panels:
GPU Utilization % — real-time compute usage
GPU Memory Used / Total — VRAM consumption in GB
GPU Temperature — degrees Celsius
GPU Power Draw — watts
For Ollama deployments, watching GPU memory usage is especially important. If the model exceeds available VRAM, Ollama offloads layers to system RAM, which dramatically increases response latency.
Filtering by Application
Because the pipeline tags all traces with application_name="openwebui", you can filter the dashboard to show only traffic from OpenWebUI — useful if you have other applications sending data to the same OpenLIT instance.
Troubleshooting Common Issues
No traces appearing in the dashboard:
Confirm the OpenLIT stack is running:
docker compose psfrom theopenlitdirectoryCheck that
otlp_endpointis reachable from the pipeline container:curl http://host.docker.internal:4318Inspect pipeline logs:
docker logs pipelines
GPU stats not showing:
NVIDIA GPU required; AMD and Apple Silicon are not supported by the NVML library
The pipeline container needs access to the host's GPU via
--gpus allin the Docker run command
High latency on first request:
Normal for Ollama: the first request loads the model into GPU memory (model loading). Subsequent requests are much faster once the model is resident.
Conclusion and Next Steps
By integrating OpenLIT with OpenWebUI, you gain full observability and monitoring capabilities, enabling you to:
Track API usage and performance — token counts, latency percentiles, error rates per model
Monitor GPU resource consumption — utilization, memory, temperature, and power draw for local deployments
Optimize model inference — compare response times across models to choose the best one for your use case
Audit prompt and response history — centralized logging for security review and quality assurance
Next Steps
Explore more pipeline configurations: OpenWebUI supports multiple concurrent pipelines; you can stack a moderation pipeline on top of the monitoring pipeline.
Customize OpenLIT metrics: Add custom span attributes using the OpenTelemetry Python SDK to tag traces with user IDs, session IDs, or conversation topics.
Scale your deployment: Run multiple pipeline servers behind a load balancer and configure all of them to send telemetry to a shared OpenLIT backend for fleet-wide visibility.
Connect to external backends: Forward OpenLIT's OpenTelemetry data to Grafana or Datadog for unified dashboards alongside your existing infrastructure metrics.
With this setup, you have complete visibility into how LLMs are being used in your OpenWebUI deployment — from individual token counts to GPU thermal performance.

- Name
- wolfgangsmdt