- Published on
Unlocking Seamless GenAI & LLM Observability with OpenLIT
Introduction
In the world of GenAI projects, seamless observability is key to unlocking top-notch performance and reliability. Meet OpenLIT, the OpenTelemetry-native GenAI and LLM Application Observability tool that's set to reshape the way you monitor and optimize your applications. With just a single line of code, OpenLIT makes integrating observability into your GenAI projects as easy as possible.
Understanding LIT: LIT, short for Learning and Inference Tool, is a visual and interactive tool designed to provide insights into AI models and visualize data. Originally introduced by Google, LIT offers a user-friendly interface for understanding the inner workings of AI models and analyzing data effectively. OpenLIT extends this philosophy to production monitoring.
This guide covers what OpenLIT does, how to get started in under five minutes, and how to interpret the data it generates for your LLM applications.
Why Observability Matters for LLM Applications
Traditional application monitoring tracks CPU usage, memory, error rates, and response times. For LLM applications, these metrics are necessary but not sufficient. You also need to know:
How many tokens are consumed per request — both prompt tokens and completion tokens
What each inference costs — especially important when using pay-per-token APIs like OpenAI or Anthropic
How long the model takes to respond — first-token latency versus total generation time
What prompts and responses look like — for debugging unexpected outputs or regressions
How vector database queries are performing — latency, result count, and embedding dimensions
Without visibility into these dimensions, optimizing an LLM application is guesswork. OpenLIT provides all of them automatically, without requiring you to write custom instrumentation code.
Getting Started with OpenLIT in 5 Minutes
Installation
Install the OpenLIT Python SDK using pip:
pip install openlitInitialize in Your Application
Add two lines to your application entrypoint:
import openlit

openlit.init()
By default, OpenLIT sends OpenTelemetry traces and metrics to http://localhost:4318 (the standard OTLP/HTTP endpoint). If you are running OpenLIT's all-in-one Docker container, this is already configured for you.
Start the OpenLIT Stack
Run the OpenLIT observability stack using Docker Compose:
git clone https://github.com/openlit/openlit.git
cd openlit
docker compose up -d
This starts OpenLIT's UI (available at http://localhost:3000), ClickHouse for storage, and an OpenTelemetry Collector pre-configured to receive your application's telemetry.
Instrument Your First OpenAI Call
Here is a complete working example:
import openlit
from openai import OpenAI

openlit.init()  # starts collecting traces and metrics

client = OpenAI()

response = client.chat.completions.create(
    model="gpt-4o",
    messages=[{"role": "user", "content": "What is OpenTelemetry?"}]
)

print(response.choices[0].message.content)
After running this, navigate to http://localhost:3000 and you will see the trace appear in the Requests view within seconds.
What OpenLIT Instruments Automatically
OpenLIT complies with the OpenTelemetry Semantic Conventions for Generative AI, which means the attributes it captures have standardized names that are compatible with every OpenTelemetry-aware observability backend.
For each LLM call, OpenLIT automatically captures:
| Attribute | Example Value |
gen_ai.system | openai |
gen_ai.request.model | gpt-4o |
gen_ai.prompt | The full prompt sent |
gen_ai.completion | The full response received |
gen_ai.usage.prompt_tokens | 45 |
gen_ai.usage.completion_tokens | 128 |
gen_ai.usage.total_tokens | 173 |
gen_ai.usage.cost | 0.000346 (USD) |
gen_ai.request.temperature | 0.7 |
gen_ai.request.max_tokens | 512 |
| Duration (span) | 1.24s |
For vector database calls (ChromaDB, Pinecone, Qdrant, Milvus), it captures query type, collection name, embedding dimensions, and query latency.
Features that Make OpenLIT Stand Out
Monitor LLM and VectorDB Performance
OpenLIT automatically generates traces and metrics, giving insights into your application's performance and costs. You can track performance in different environments and optimize resource use efficiently.
Every request becomes a distributed trace with spans for each LLM or VectorDB call. If you are using a framework like LangChain that chains multiple model calls together, each call appears as a child span under the parent trace, giving you full end-to-end visibility.
Cost Tracking for Custom and Fine-Tuned Models
You can customize and track costs for specific AI models using OpenLIT's custom JSON pricing file. The built-in pricing database covers all major providers. For fine-tuned models or custom deployments, you supply a JSON file like this:
{
  "my-fine-tuned-gpt4": {
    "prompt_token": 0.00003,
    "completion_token": 0.00006
  }
}
Pass the path when initializing:
openlit.init(pricing_json="/path/to/custom_pricing.json")This helps in precise budgeting and aligning costs with your project needs, especially when running multiple fine-tuned models across different teams.
OpenTelemetry-Native SDKs
OpenLIT supports OpenTelemetry natively, ensuring smooth integration without added complexity. Being vendor-neutral, it easily fits into your existing AI stack. This means your traces can flow to Grafana, Datadog, New Relic, SigNoz, Jaeger, or any other OTLP-compatible backend — you are not locked into OpenLIT's own UI.
The SDK's auto-instrumentation capabilities currently cover:
LLM Providers: OpenAI, Azure OpenAI, Ollama, Cohere, Anthropic, GPT4All, Mistral, HuggingFace, Amazon Bedrock, Vertex AI, Groq, and more.
Vector Databases: ChromaDB, Pinecone, Qdrant, Milvus
Frameworks: LangChain, LiteLLM, LlamaIndex, Haystack, EmbedChain
Observability Backends: Prometheus, OpenTelemetry Collector, Grafana, Jaeger, New Relic, Datadog, SigNoz, Dynatrace, OpenObserve, Highlight.io
Understanding the OpenLIT Dashboard
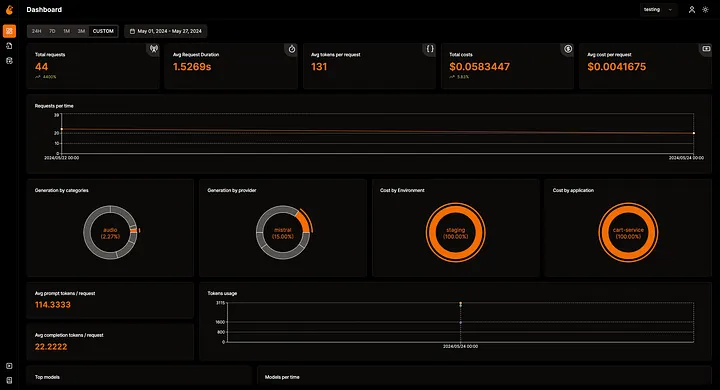
Overall Usage
The main dashboard shows total requests, request duration percentiles (p50, p95, p99), token usage broken down by prompt and completion, total cost analysis, and historical trends. All data updates in real time.
Requests View
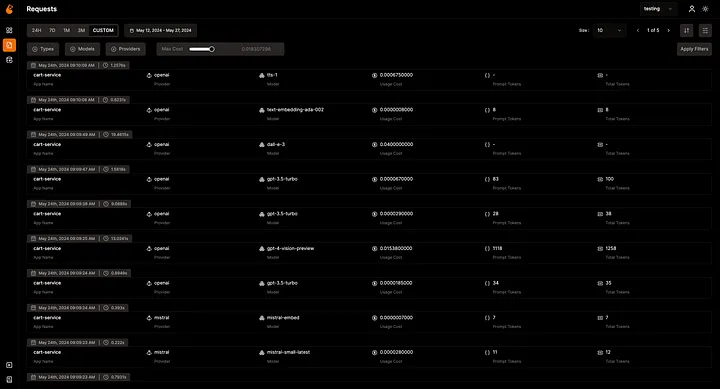
The Requests view provides an integrated trace list. Each row represents one LLM call and shows model name, token counts, cost, duration, and status. Clicking any row expands to show the full prompt, the complete response, all trace attributes, and timing breakdown. You can filter by model, environment, time range, or apply custom filters on any attribute.
Database Config
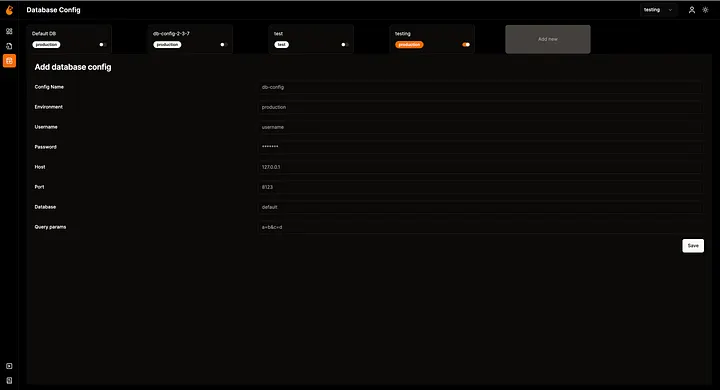
OpenLIT supports connecting to multiple ClickHouse databases, making it convenient to separate data from different environments (development, staging, production) or different teams within the same UI.
Sending Data to External Backends
If you already have Grafana or Datadog, you can forward OpenLIT's OpenTelemetry data there instead of (or in addition to) the OpenLIT UI. Configure the OTLP endpoint when initializing:
openlit.init(otlp_endpoint="https://your-grafana-instance:4318")Or set the standard OpenTelemetry environment variable:
OTEL_EXPORTER_OTLP_ENDPOINT=https://your-backend:4318 python your_app.pyBest Practices for LLM Observability
1. Tag requests by environment and application. Pass environment and application_name to openlit.init() so you can filter dashboard views by deployment stage.
openlit.init(
    environment="production",
    application_name="customer-support-bot"
)
2. Monitor cost per user or session. Use OpenTelemetry baggage or custom span attributes to associate costs with user IDs, enabling per-customer cost tracking.
3. Set cost alerts. Connect your OTLP data to an alerting backend (Grafana Alerts, Datadog Monitors) and trigger alerts when hourly spend exceeds a threshold.
4. Track prompt/completion ratios. A high completion-to-prompt ratio can signal that your system prompts are too long. Monitoring this ratio over time guides prompt optimization efforts.
5. Use sampling wisely in production. For very high-throughput applications, configure head-based sampling on the OpenTelemetry Collector to reduce storage costs while preserving error traces.
Conclusion
OpenLIT removes the friction from LLM observability. With a single openlit.init() call, you get full traces, token metrics, cost tracking, and dashboard visibility across every LLM provider and vector database your application touches. Because it is built on OpenTelemetry's open standards, your data is portable to any backend you already use.
The project is open source and actively maintained. Star the repository, try it in your next project, and join the community to share feedback and contribute integrations.

- Name
- Aman Agarwal
- @_typeofnull